G8keeper comes packed with a lot of features related to server monitoring. Once the g8keeper-agent is installed on the server, it can help you track and document most of the important statistics on the server. Tracking some of the statistics may need some additional configuration which can easily be done on the g8keeper admin panel. However, in the current article we shall only list the statistics that will be tracked without any additional configuration.
Once the g8keeper-agent is setup on the server, you will start seeing following statistics on the server dashboard:
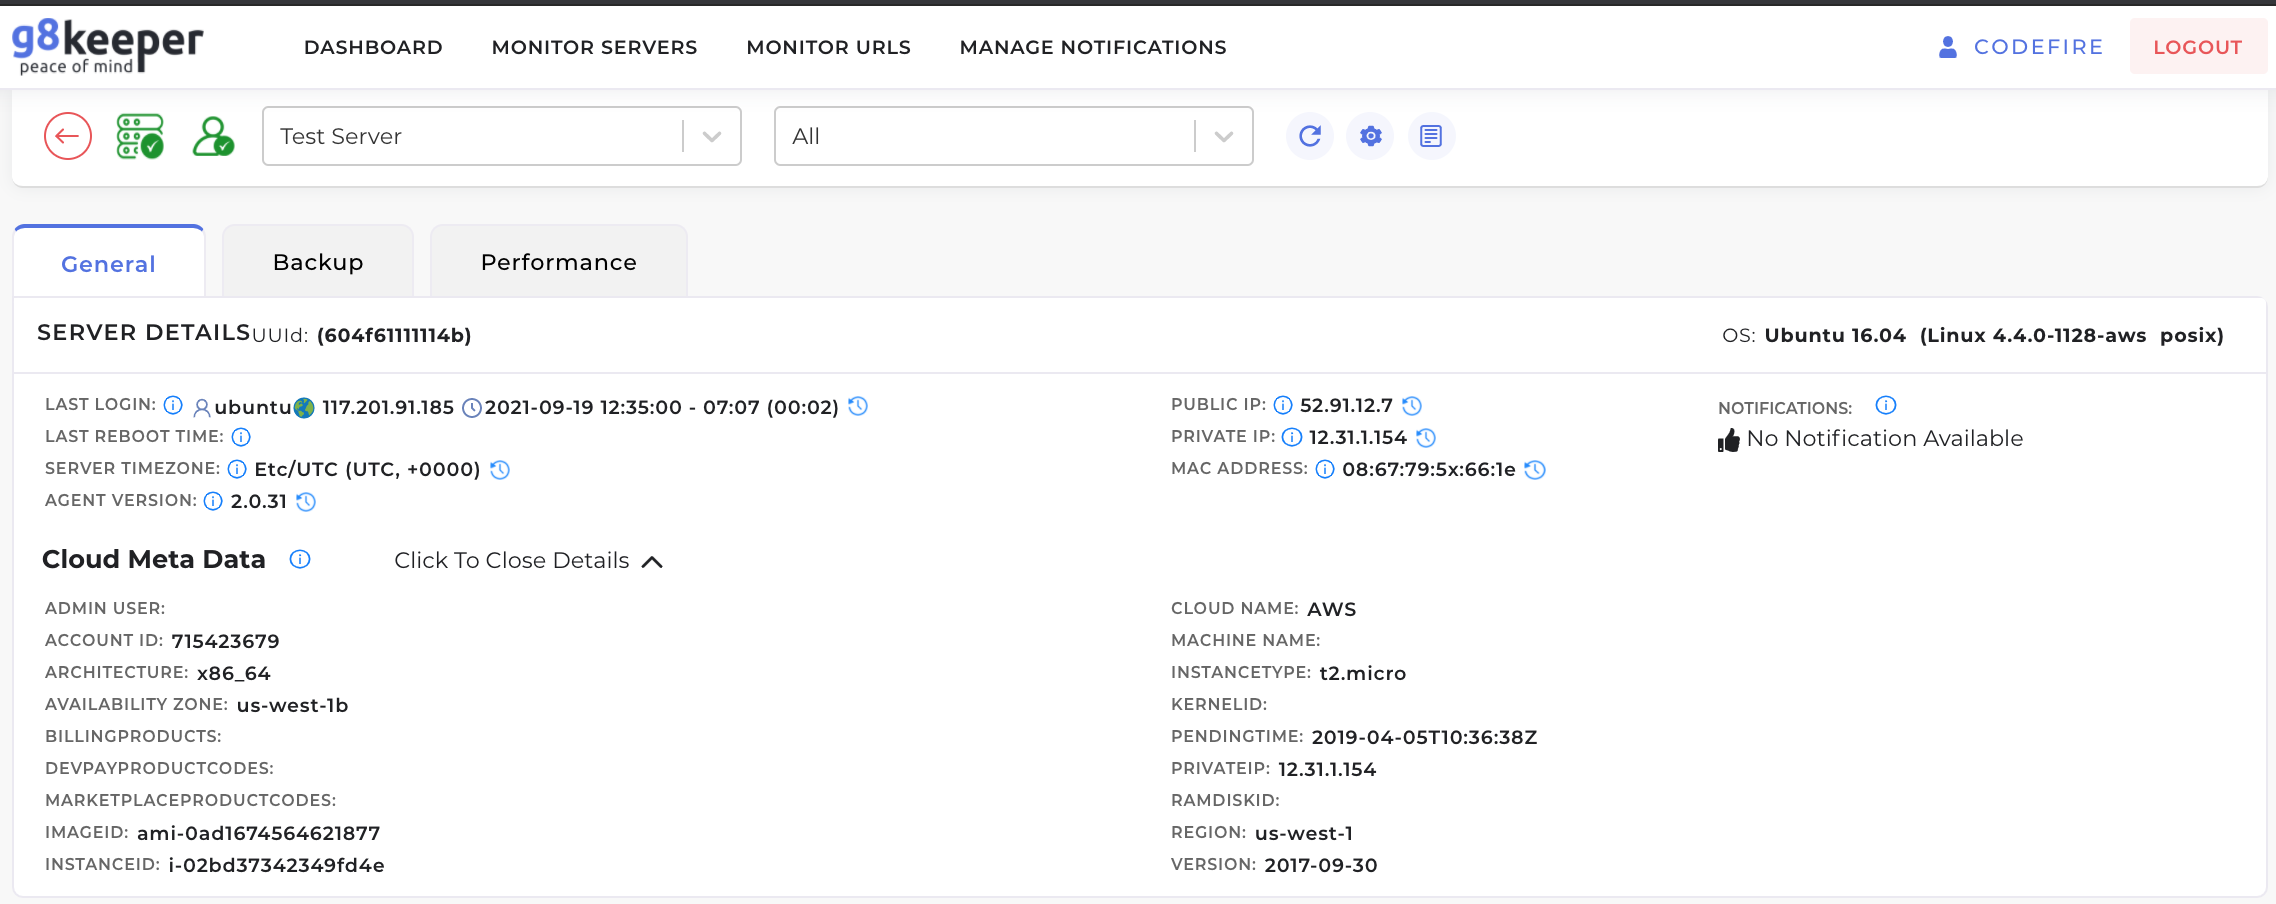
1. Basic Statistics: G8keeper tracks if anyone is currently logged into the server using SSH and reports that in real time. Along with that, it keeps log of all the logins, reboot time, timezone setup on server, public and private IPs of the server and mac-address. Along side that it identifies that Cloud service provider (such as AWS, GCP, Azure, Digital Ocean etc) and list some of the important stats from them.
2. CPU Stats and Top processes: G8keeper collects CPU stats and details of the related processes that consume the CPU. This information is displayed in intuitive dashboard, where you can easily correlate the information to quickly identify issues if any.
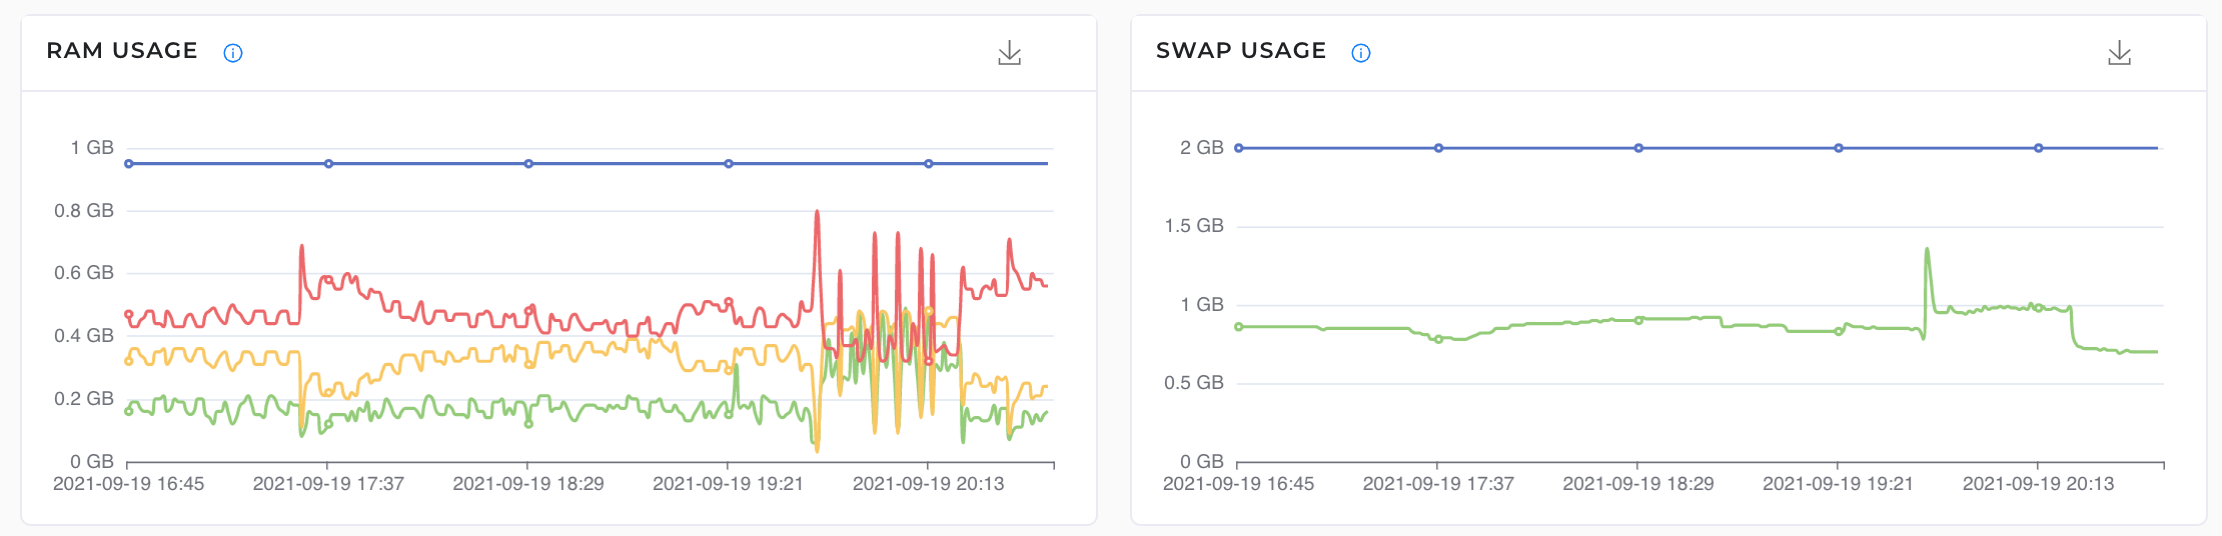
3. RAM and Swap usage: Ram and swap usage on the server is collected and displayed.
4. Disk IO and related processes: One of the very important yet difficult information to track is how much Disk IO is happening on the server and more importantly which process is causing the disk io. G8keeper solves that problem and that too in a very neat way. Just like CPU usage, you can mouse over the area on disk io chart and view the related processes. See below image.
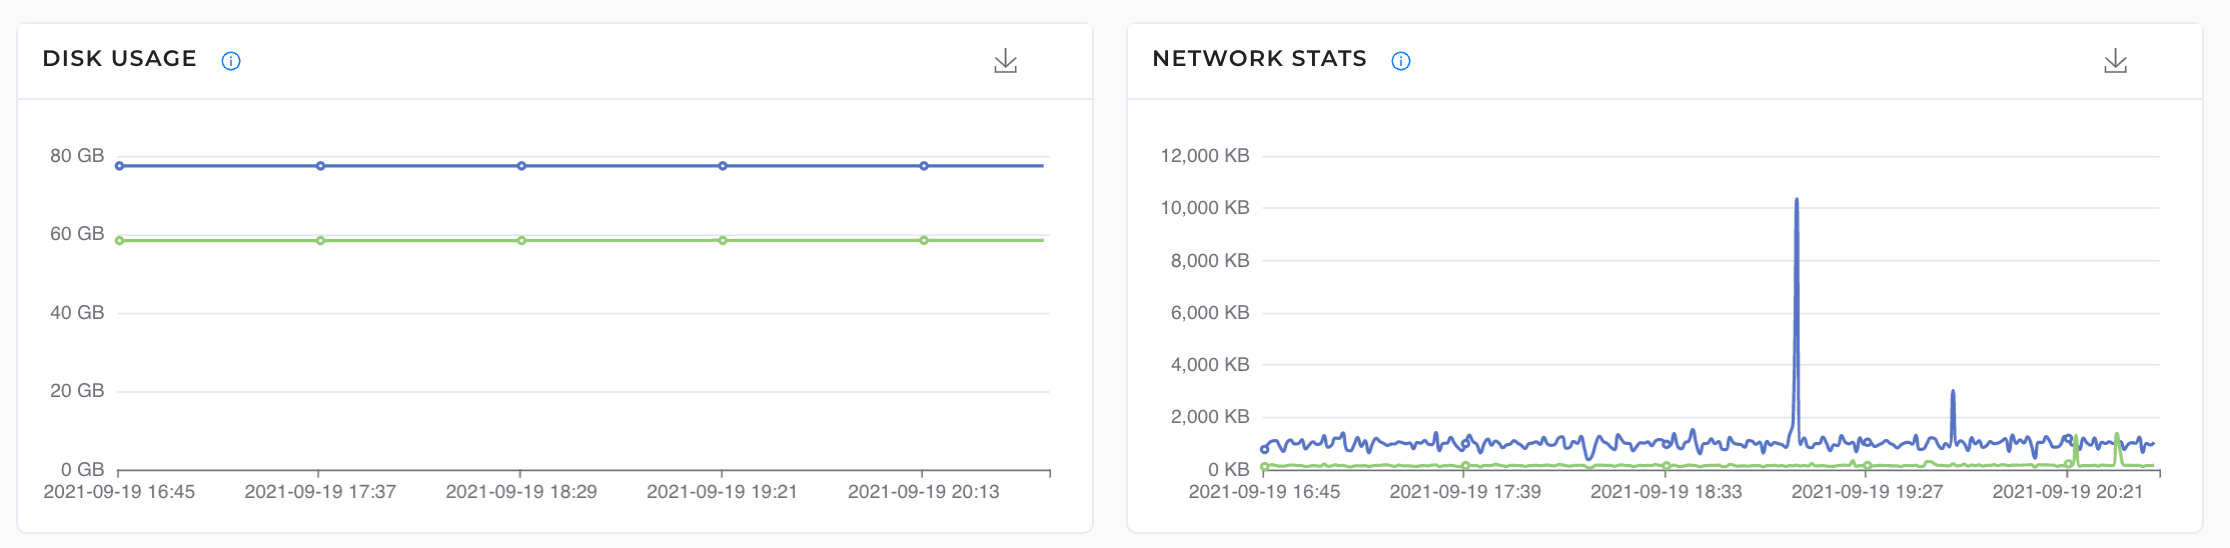
5. Network stats and disk usage: G8keeper tracks the network io and displays the same. Along side we keep track of how much total disk has been used up so you can setup alerts on 80 / 90% usage of total disk space and monitor the same.
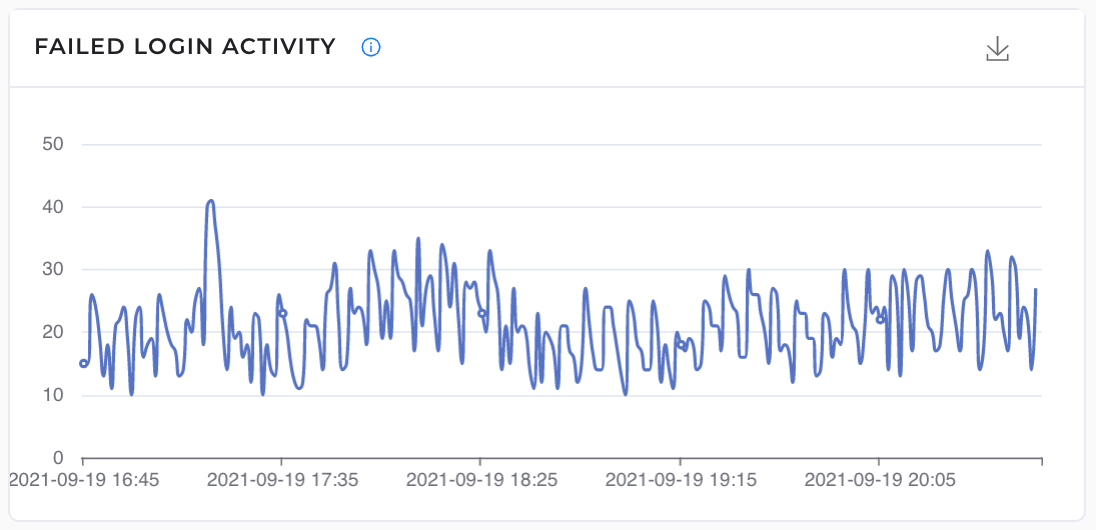
6. Failed Login Attempts: All the servers that are exposed to web traffic are constantly under hacking attempts by automated bots. If the SSH port is open on the server, bots continuously attempt to brute force into the server. G8keeper tracks such activity and reports the same on the dashboard.
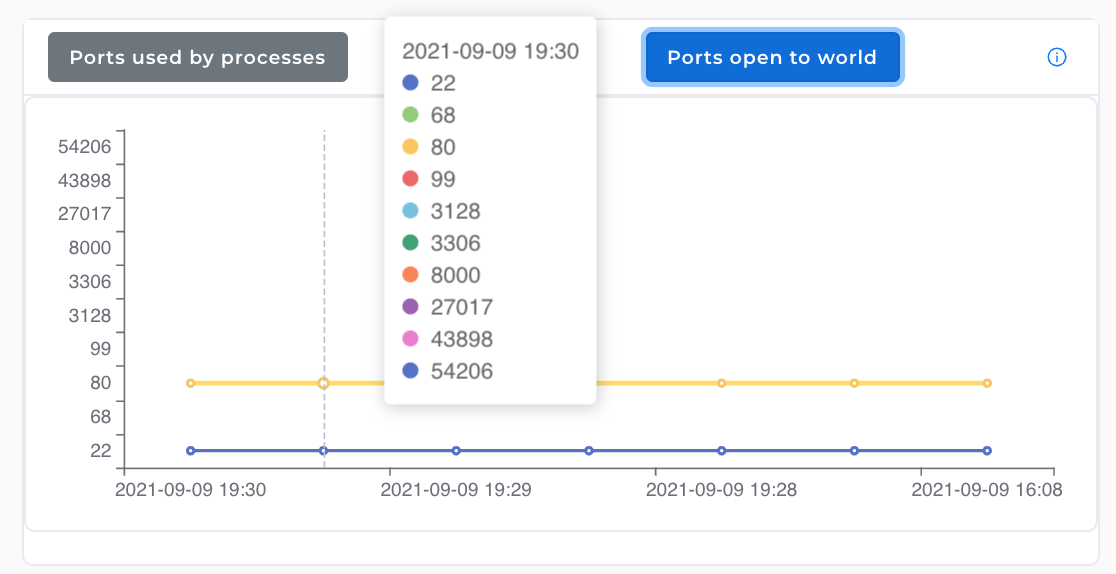
7. Ports in use and exposed to web:
G8keeper-agent monitors the port opened and listening on the server. It also tracks the processes that are using the port. All of this information is displayed in simple to use charts
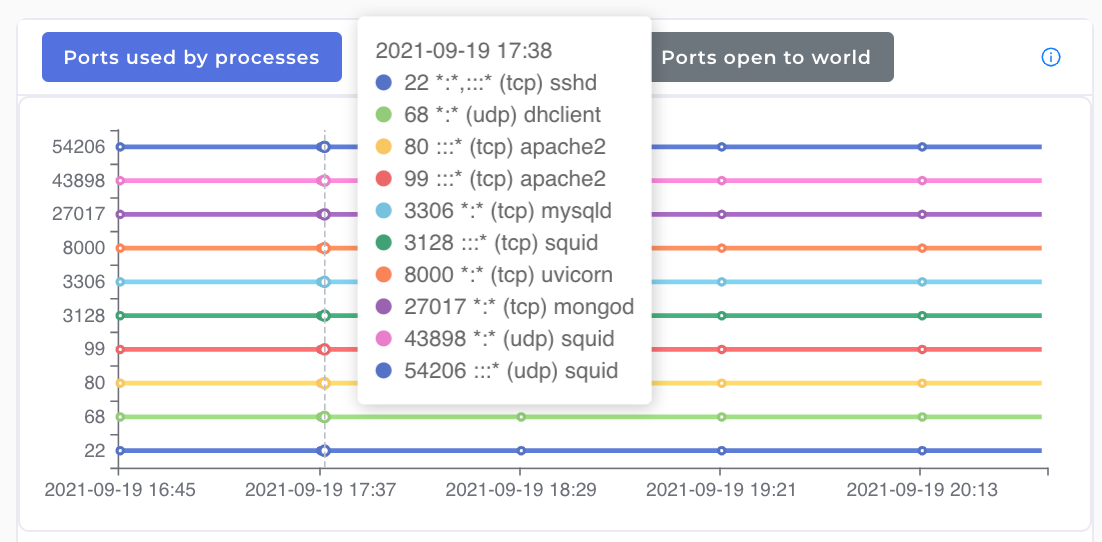
G8keeper also checks to see if all the ports that are being used internally are also exposed to web traffic. It lists the ports that are actually exposed to web on a separate chart
There are a lot of other very useful features on G8keeper Server monitoring, they require a bit of additional configurations. Some of these features are:
1. Manage Backups: G8keeper can be used to take backup of (MySQL) database and various folders on the server. The backups can be saved in your own cloud storage (Google Drive, Dropbox, AWS S3)
2. Monitor Folders for change: A lot of server hack attempts made by uploading infected files on the server. You can set file / folder change monitoring on G8keeper to keep track of any unwanted changes.
3. Apache and MySQL Performance monitoring: Some simple configurations can be enabled to monitor performance of Apache and MySQL
More details on how to configure these and how these can be tracked will be added in the subsequent part 2 of this blog.